

Chip Stock Investor has been following the neo-cloud movement since the beginning, and owns shares of CoreWeave (CRWV) and Nebius (NBIS) — with the first investment being Nebius during the tariff selloff of March-April 2025.
In August 2025, we did a multi-part video and article series on Semi Insider (see links below) discussing how to evaluate high-growth capital-intensive businesses like these ones. “Capital-intensive,” in this context, meaning high amounts of capital expenditures (CapEx) on property, data center construction, GPU servers, and related infrastructure. Like the hyperscalers, this makes the neo-cloud businesses a type of 21st century utility business (hosted computing being the subscription service, cloud rent, or tech tax, pick your label).
For the record, this framework can also be used for the other neo-clouds, as well as the hyperscalers, as their use of debt comes under increasing scrutiny.
Here is a brief refresh on the framework following CSI Live August 12, 2026 with some updates on the two leading neo-clouds after Q2 2026 earnings.
The economics of a GPU-based cloud are theoretically sound
First, a quick look at the revamped company comparison tool on the upcoming Research Dashboard re-launch. CoreWeave in particular has actually been operating at close to GAAP operating profit break-even. It would seem this can be pulled off with as little as $1 billion in quarterly revenue (Nebius is quickly working its way towards that milestone; traditional small-business cloud and now GPU cloud DigitalOcean has also worked out these economics with just a few hundred million dollars in quarterly revenue).
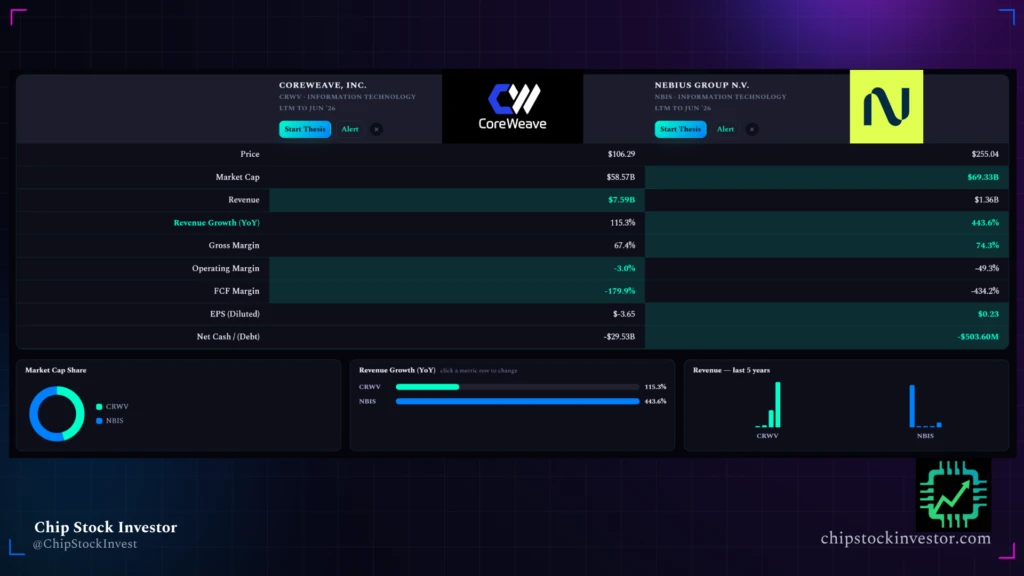
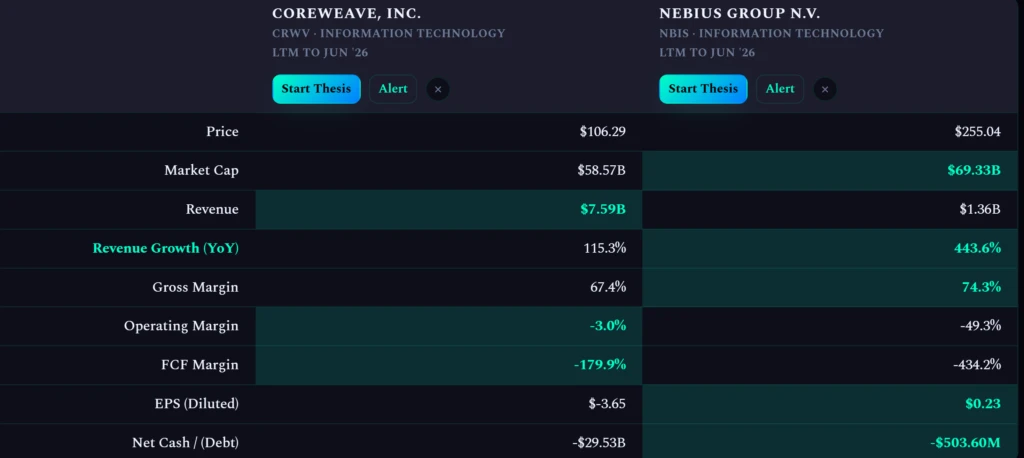
But for a capital intensive business in high-growth mode, operating profitability (not to mention adjusted EBITDA that CoreWeave and Nebius use) is still a theoretical, a benchmark to track the future businesses’ financial viability. That’s because we need to incorporate the effect of rising net debt on the balance sheet.
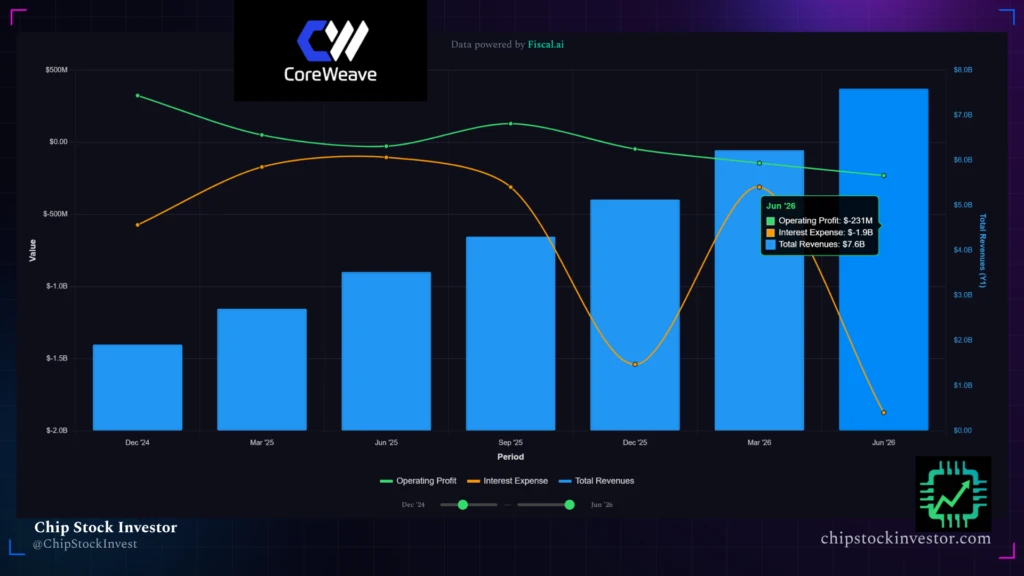
CoreWeave in particular is already there (see $30 billion in net debt on balance in chart above). This has equated to interest expense of $1.9 billion through the last 12-month period. So no, the business is not close to profitable yet, even if it decided to turn off all of its CapEx spending today. (The car’s efficiency isn’t improving right now, and the gas tank is gradually being used up.)
A few balance sheet metrics to track
This is why, for high-growth business, the revenue growth (engine) is a fine place to start a search for big potential winning investments. But looking at the balance sheet health (gas tank) and the business’s overall efficiency (how much fuel is that sales engine consuming) is where you’ll figure how to narrow the field of companies with better chances at longevity.
Three metrics that can help are the CapEx-to-revenue, debt-to-equity, and debt-to-asset ratios. Over time, CapEx-to-revenue should be less than 1.0, and as close to 0 as possible (0.1 to 0.2 or less is an efficient business machine); debt-to-equity and debt-to-asset ratios measure health of the fuel tank, and if these numbers begin to climb sharply, it indicates a fuel tank running low and susceptible to a business breakdown (usually an industry or broader economic event triggers this, but balance sheet health is an early flag).
Generally, a debt-to-equity ratio over 2.0 is an indicator of excessive leverage that will lead to higher interest expense; and a debt-to-asset ratio over 1.0 indicates liabilities exceed assets, which means a company would be technically insolvent if all suppliers, creditors, and other stakeholders owed money tried to redeem liabilities from the business all at once.
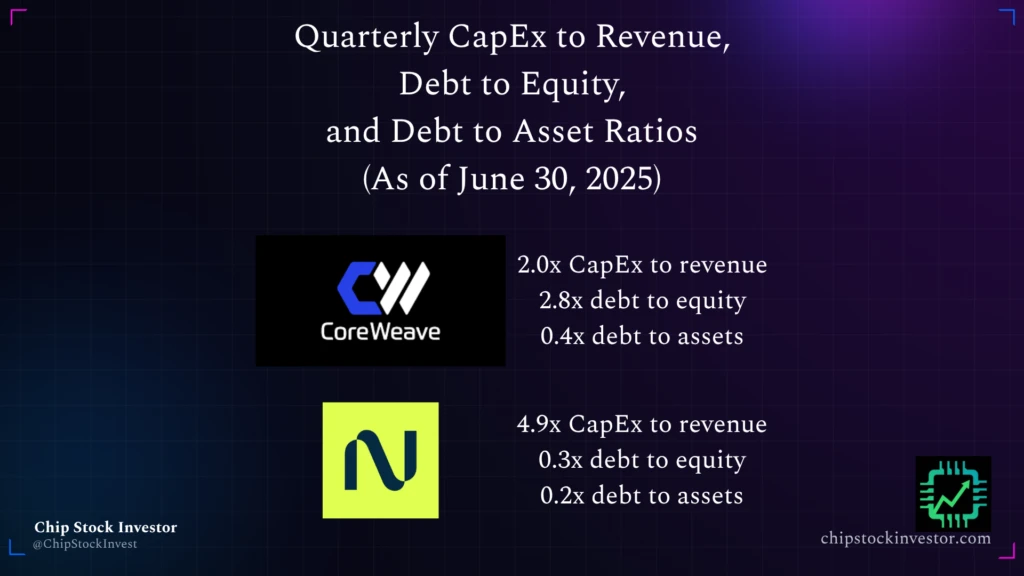
Here were the metrics for the two businesses we reviewed this time in 2025.
CRWV:
- CapEx to revenue of 2.0
- Debt to equity of 2.8
- Debt to assets of 0.4
NBIS:
- CapEx to revenue of 4.9
- Debt to equity of 0.3
- Debt to assets of 0.2
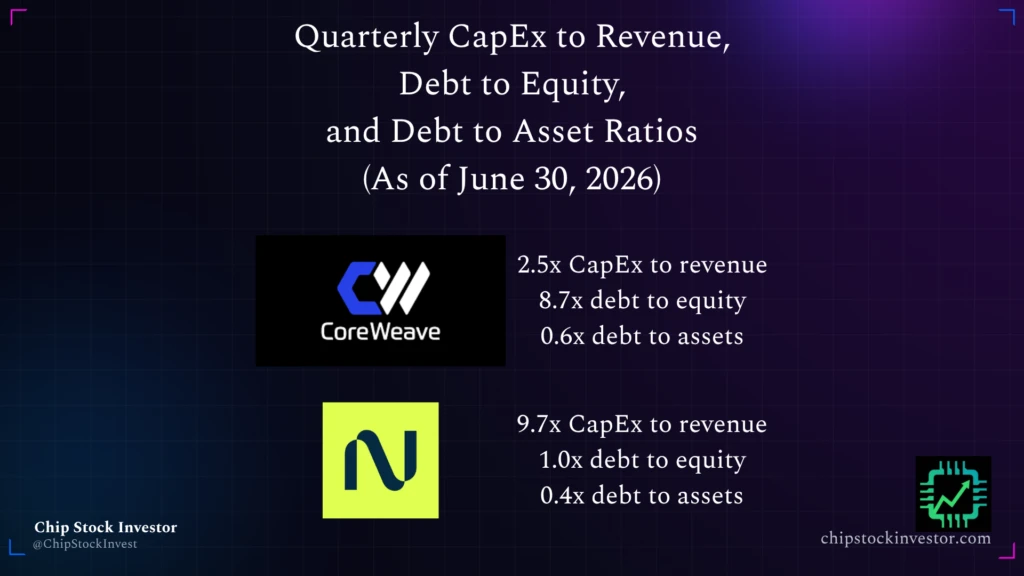
And here’s how the metrics stack up a year later. The significantly higher debt-to-equity ratio for CRWV in particular is one reason why CRWV stock has under-performed NBIS in the last year, and now fetches a lower market cap than NBIS.
CRWV:
- CapEx to revenue of 2.5
- Debt to equity of 8.7
- Debt to assets of 0.6
NBIS:
- CapEx to revenue of 9.7
- Debt to equity of 1.0
- Debt to assets of 0.4
And the three ratios charted out over the last few years:
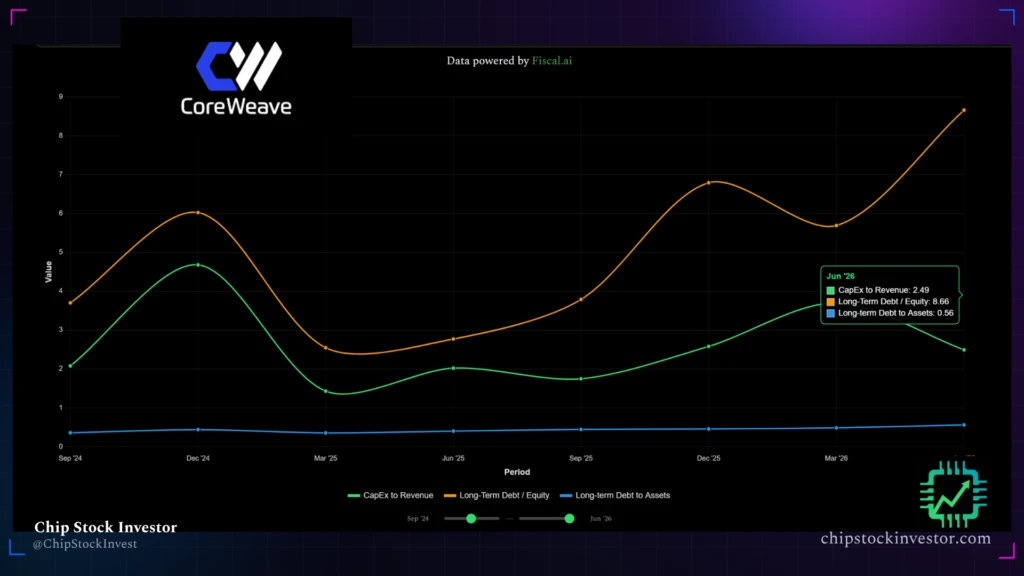

At this stage, CSI is content holding these two positions, although the recent run-up in NBIS has us thinking about right-sizing the position. However, the increasing amount of leverage for CRWV in particular, as well as other neo-cloud companies, must be monitored as the demand environment for compute evolves in the coming years.
Join us on Semi Insider for more! We are building a new set of tools to help investors build repeatable processes, and track their portfolios and investment theses, complete with robust data and help from investment professionals with real-world experience managing money.
